
Home prices ticked up in the middle of the summer but still comfortably trailed inflation, a new industry report found.
The S&P Cotality Case-Shiller home price index rose 1.9% year over year in July, up from a 1.6% increase
"While home prices continued to decline in real terms in July 2026, marking the 14th consecutive month of real declines, slightly lower inflation and stronger nominal home price appreciation helped narrow the gap," said Rebecca Kaufman, associate director of commodities at S&P Dow Jones Indices, in a press release Tuesday.
Although
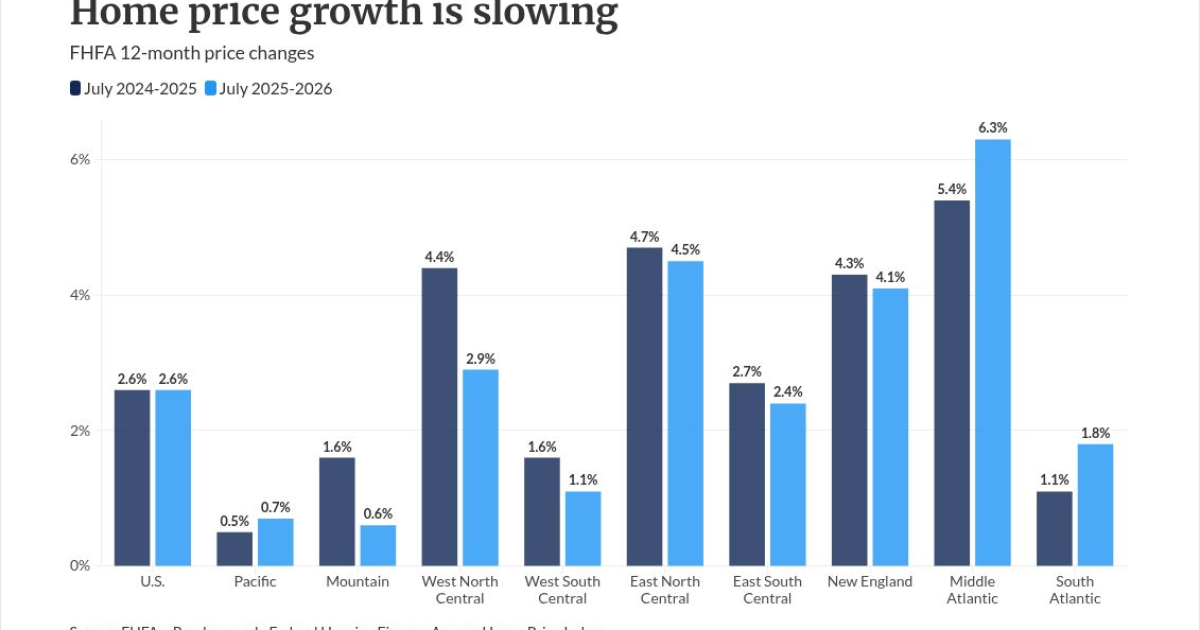
U.S. Federal Housing's House Price Index posted a 2.6% annual gain. Both indexes found prices climbed 30 basis points on a seasonally-adjusted monthly basis. On a nonseasonally adjusted basis, the Case-Shiller index rose 12 basis points from March, smaller than its modified counterpart in a departure from typical summer patterns.
"This suggests seasonal factors weighed heavily on
Regional differences
Of the nine census divisions the FHFA analyzes, all of them experienced annual price increases in July, ranging from 0.6% in the Mountain region to 6.3% in the Middle Atlantic division. On a monthly basis, changes range from -0.8% to 1.5%, with the Mountain and Middle Atlantic divisions again serving as bookends.
Case-Shiller's 10-city composite posted an annual jump of 3.4%, while the 20-city composite rose 2.5% year over year, both up from the 3% and 2.2% hikes in June. Chicago continues to record the strongest gains, leading the country at 6.9%. New York and Cleveland followed suit at 5.8% and 4.2%, respectively. Seattle saw the lowest return in July, with prices falling 2.3%.
The seasonally-adjusted 10- and 20-city composites recorded month-over-month increases of 0.4% and 0.3%, respectively.
"The years-long East-West divide persists, with six out of the eight eastern metropolitan markets recording greater year-over-year changes in July versus June, compared with just two of the eight western metropolitan markets," Kaufman said.