Enjoy complimentary access to top ideas and insights — selected by our editors.
According to data from LendingTree, the top five cities with the
Read more about the 20 cities with the highest homeownership rates.
| Rank | Metro | Rate of housing units that were owner-occupied in 2022 | 3 year percent change in rate of owner-occupied housing units | Total occupied housing units |
| 20 | Buffalo, NY | 66.12% | 0.47% | 505,423 |
| 19 | Hartford, CT | 66.47% | 0.59% | 494,046 |
| 18 | Atlanta, GA | 66.50% | 2.22% | 2,311,639 |
| 17 | Cleveland, OH | 66.57% | 2.38% | 891,430 |
| 16 | Phoenix, AZ | 66.73% | 2.18% | 1,890,835 |
| 15 | Philadelphia, PA | 66.91% | 0.22% | 2,483,863 |
| 14 | Tampa, FL | 67.00% | 0.27% | 1,329,075 |
| 13 | Jacksonville, FL | 67.21% | 1.20% | 672,026 |
| 12 | Baltimore, MD | 67.27% | 0.88% | 1,126,216 |
| 11 | Indianapolis, IN | 67.51% | 2.34% | 852,384 |
| 10 | Richmond, VA | 67.63% | 1.31% | 538,478 |
| 9 | Salt Lake City, UT | 67.65% | -0.54% | 448,172 |
| 8 | Raleigh, NC | 67.80% | 2.22% | 559,173 |
| 7 | Cincinnati, OH | 69.10% | 2.15% | 916,246 |
| 6 | Louisville, KY | 69.18% | 1.97% | 535,884 |
| 5 | Birmingham, AL | 69.46% | 1.74% | 443,821 |
| 4 | St. Louis, MO | 69.67% | 0.49% | 1,168,546 |
| 3 | Pittsburgh, PA | 70.45% | 2.26% | 1,021,314 |
| 2 | Minneapolis, MN | 70.54% | 0.38% | 1,483,453 |
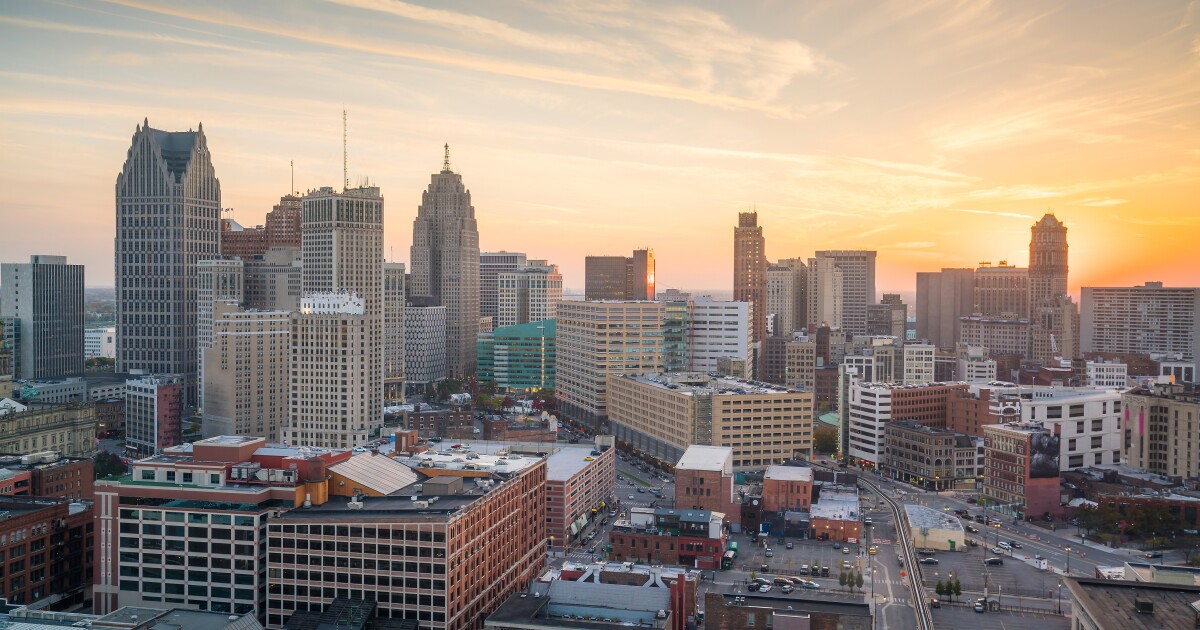
| 1 | Detroit, MI | 71.49% | 1.87% | 1,762,104 |


