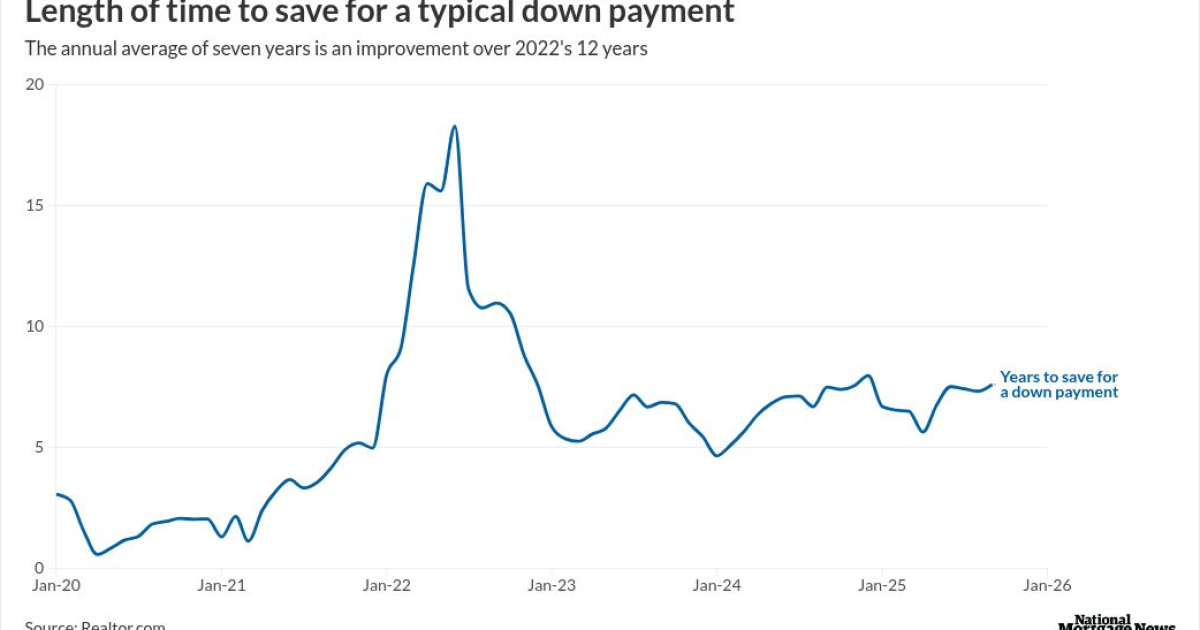
While consumer affordability when it comes to purchasing a home improved during 2025 compared with a 2022 peak, costs are significantly higher than prior to the pandemic, a pair of metrics show.
It took a U.S. household seven years
Monthly data from Realtor.com put the savings time at 18.3 years in June 2022.
The recent low was 5.6 years in April. In April and May of 2020, it took less than a year to save for the typical down payment.
"Higher home prices and intensified competition have pushed typical down payments higher, at the same time that inflation and rising household expenses have reduced savings rates," said Danielle Hale, chief economist at Realtor.com in a press release. "Although conditions have improved since 2022, today's timeline shows that saving for a home takes meaningfully longer than it did before the pandemic, especially in high-cost markets."
A wide range exists between markets
This has a wide variance based on the individual market.
For four California metropolitan areas, led by
It would take 36.5 years in San Francisco-Oakland, while in San Jose, the median down payment takes 36.2 years to save for, Realtor.com calculated.
Los Angeles-Long Beach-Anaheim was third at 34.1 years, while for San Diego, the total was 30.1 years.
New York-Newark was fifth at 23.4 years.
"In high-cost markets, the typical down payment alone exceeds a full year of household income," said Hannah Jones, senior economic research analyst at Realtor.com. "That reality makes homeownership feel unattainable for many buyers, particularly younger households trying to enter the market for the first time."
Which markets take the least time to save
At the other end of the spectrum, the most affordable major metro was San Antonio at 1.3 years. Next was Virginia Beach, Virginia, at 2 years; Memphis, Tennessee, 2.5; Houston, 3.5; followed by Birmingham, Alabama, and Jacksonville, Florida, where in both cases the median was 4.2.
On a nationwide basis,
Why homebuyer affordability improved
Meanwhile, the First American Data & Analytics Real House Price Index showed affordability improved on
But affordability remains more than 64% below the five-year average prior to the pandemic.
"The one-two punch that did the most damage to affordability after the pandemic — rapid house price appreciation followed by a sharp run-up in mortgage rates — has lost its force," said Mark Fleming, First American chief economist, in a press release. "Price growth has cooled, mortgage rates have eased from their peak, and incomes have continued to climb higher."
Fleming called the number of months' supply of homes for sale the "house price thermostat."
How many months' supply of homes is on the market
This was 4.1 months in November, with an annual, nominal price-appreciation rate of 0.6%. This compares with 3.8 months' supply and 3.5% price growth one year prior.
Among the hottest markets right now: Cincinnati, Chicago and Cleveland, according to Fleming. Strong price appreciation growth is combined with fewer months' supply in these markets.
San Antonio,
"A similar story shows up in parts of Florida," Fleming said. "Metropolitan areas,