Affordability for home buyers decreased in February by 6.3% from the month before, according to a new monthly metric from the Mortgage Bankers Association that quantifies the change resulting from rising interest rates and higher home prices.
The Purchase Applications Payment Index for February was 146.3, up from 135.1 in January (the previous index high point) and 120 for February 2021. The base month of PAPI is March 2012, with the value set at 100. It measures the borrower's mortgage-payment-to-income ratio and a higher index means affordability is less than the comparative period.
Based on an analysis of past data, February was the least affordable month for homeownership going back to July 2009, the first month for which the PAPI was calculated.
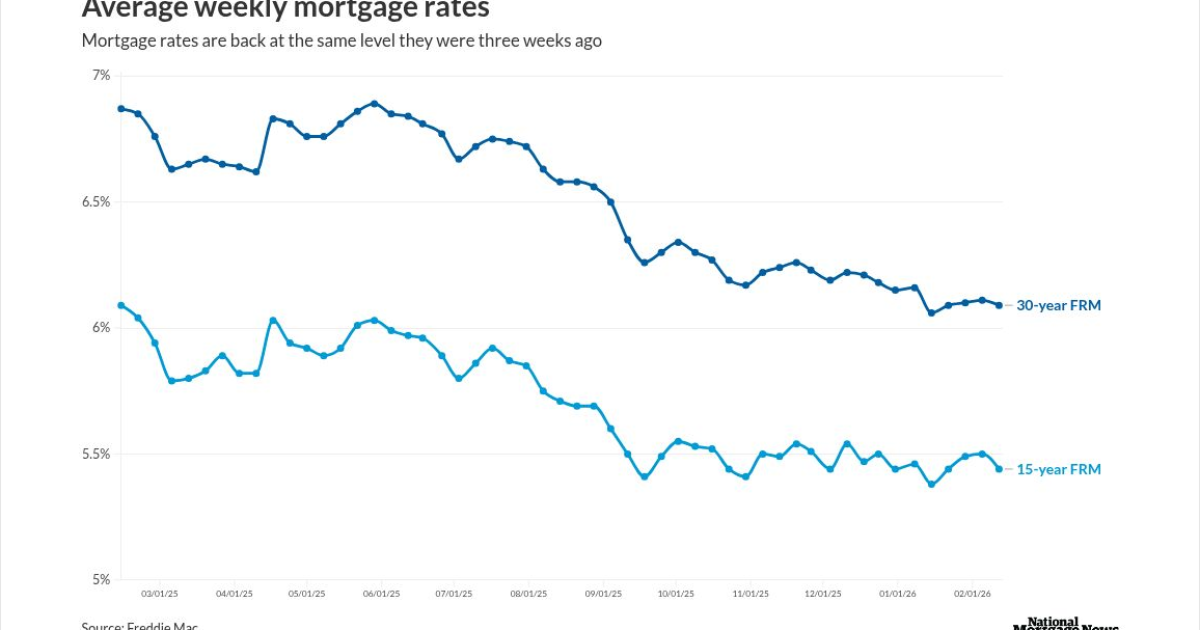
"The 30-year fixed-rate mortgage spiked 73 basis points from December 2021 through February 2022," Edward Seiler, the MBA's associate vice president, housing economics, and the executive director of the Research Institute for Housing America, said in a press release. "Together with increased loan application amounts, a mortgage applicant's median principal and interest payment in February jumped $127 from January and $337 from one year ago."
The national median mortgage payment for applicants for all loan products in February was $1,653 in February, up from $1,526 in January and $1,316 in February 2021.
For those seeking Federal Housing Administration-insured loans, the median monthly payment was $1,201 in February, compared with $1,142 in January and $1,009 in February 2021.
Conventional loan applicants — which includes conforming and jumbo mortgage borrowers — had a median payment of $1,749 in February, up from $1,582 in January and $1,391 in February 2021.
The PAPI is unique in that it uses data from the MBA's Weekly Applications Survey to calculate the principal and interest portion of borrowers' mortgage payments, an FAQ said.
By race, homebuyer affordability decreased for Black households, with the national PAPI increasing to 151.6 in February from 140.0 in January, while for Hispanics it rose to 136.4 from 125.9 and for whites, it moved up to 147.9 from 136.6.
The five states with the highest PAPI in February were: Idaho (221.3), Nevada (216.5), Arizona (189.4), Utah (181.6) and Washington (180.4).
At the other end of the spectrum, the most affordable areas were: the District of Columbia (86.3), Connecticut (91.8), Alaska (94.8), Iowa (101.2) and Wyoming (104.1).
Before January, the least affordable month was May 2018. Only 12 months had a PAPI lower than the base index set to March 2012, all of which were between September 2011 and January 2013.


