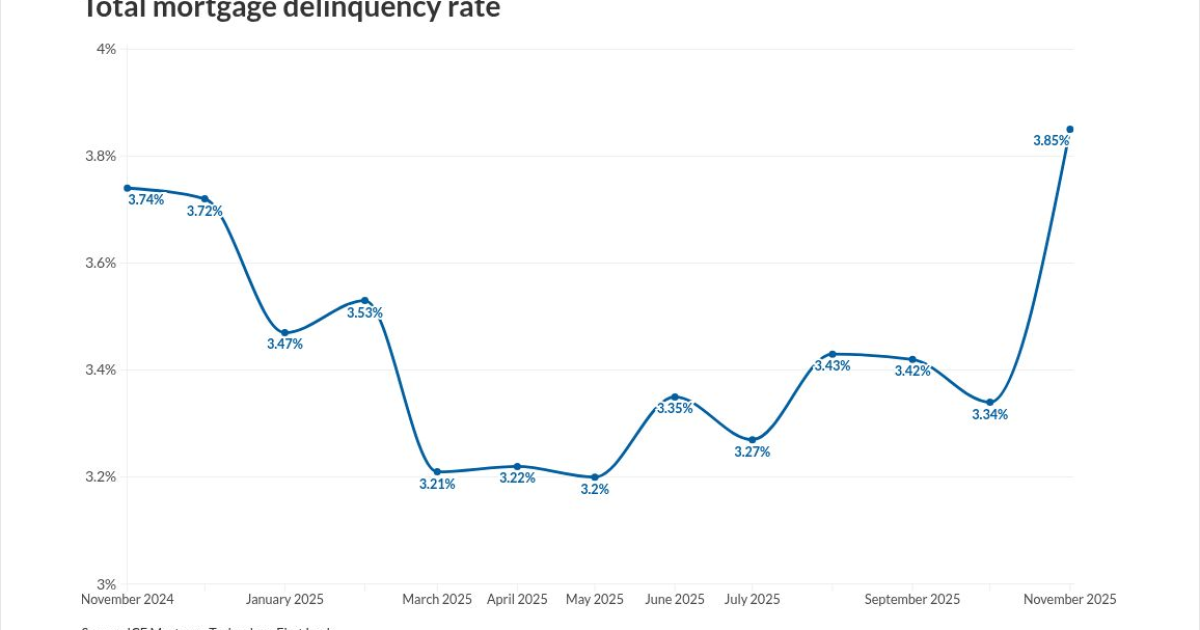
Mortgage delinquency rates rose sharply last month, hitting a four-year high, but those numbers are still in line with historical trends, according to the latest ICE Mortgage Technology First Look report.
The number of mortgages past due rose by 275,000 to 2.3 million from October to November, bumping up the national delinquency rate to 3.85%. The change
"While the topline delinquency numbers show a sharp increase, we've seen comparable spikes in prior years when November ended on a Sunday and scheduled payments didn't post until early December," said Andy Walden, head of mortgage and housing market research at ICE, in a press release Tuesday. "Overall performance was in line with what historical patterns would suggest. That said, December data will be important to watch to confirm how quickly borrowers recover from this temporary uptick."
Borrowers won't get much of a boost from
November's spike in delinquency was in line with prior years when the month ended on a Sunday. It last occurred in 2014, 2008 and 2003, which saw increases of 61, 112 and 57 basis points, respectively, all surpassing this year's 50-basis-point hike.
The report also found that 609,000 borrowers who made on-time payments in October became delinquent in November, marking the largest single-month inflow of newly delinquent borrowers since May 2020. Rolls from 30- to 60-day and 60- to 90-day delinquency bands also rose sharply.
The number of properties 30 or more days past due but not in foreclosure hit 2.1 million, up 274,000 from October and 87,000 from last November. Properties 90 or more days delinquent increased by 54,000 month over month and 18,000 year over year to 530,000.
In line with the rest of the report, prepayment activity fell 18% month over month after reaching a three-and-a-half-year high in October. The monthly prepayment rate was 0.83%, still 30.55% more than November of last year.
Foreclosure activity dropped last month due to seasonal effects, but foreclosure starts, sales and active foreclosure volumes were all still at least 21% above last year's levels. Foreclosure starts were marked at 26,000, down 31.5% month over month but up 24.8% on a yearly basis.
Where were delinquencies and foreclosures most prevalent?
Louisiana and Mississippi recorded the highest noncurrent percentage, delinquencies and foreclosures, at 8.75% and 8.74%, respectively. Alabama, Arkansas and Indiana rounded out the top five, all sitting in the 6% to 7% range.
Washington and Idaho posted the lowest percentages, both below 2.3%, while Montana, Colorado and California followed with percentages near 2.4%.
East coast states saw the largest year-over-year decreases, led by Florida and South Carolina at 7.07% and 4.72%, respectively. The largest year-over-year increases were a bit more scattered throughout the country, as Maryland saw a 16.4% jump, followed by Utah, Arizona and Arkansas.